
Reports & dashboards
Everything in the Insights group is read-only, so any role from Viewer up can read it. It’s where you watch the business: what’s active, what’s being used, and what’s running. (Viewer and up)
Dashboard
Section titled “Dashboard”Insights → Dashboard is the at-a-glance view — active subscriptions, trials, license utilization, the entitlement mix, quota health and where your customers are.
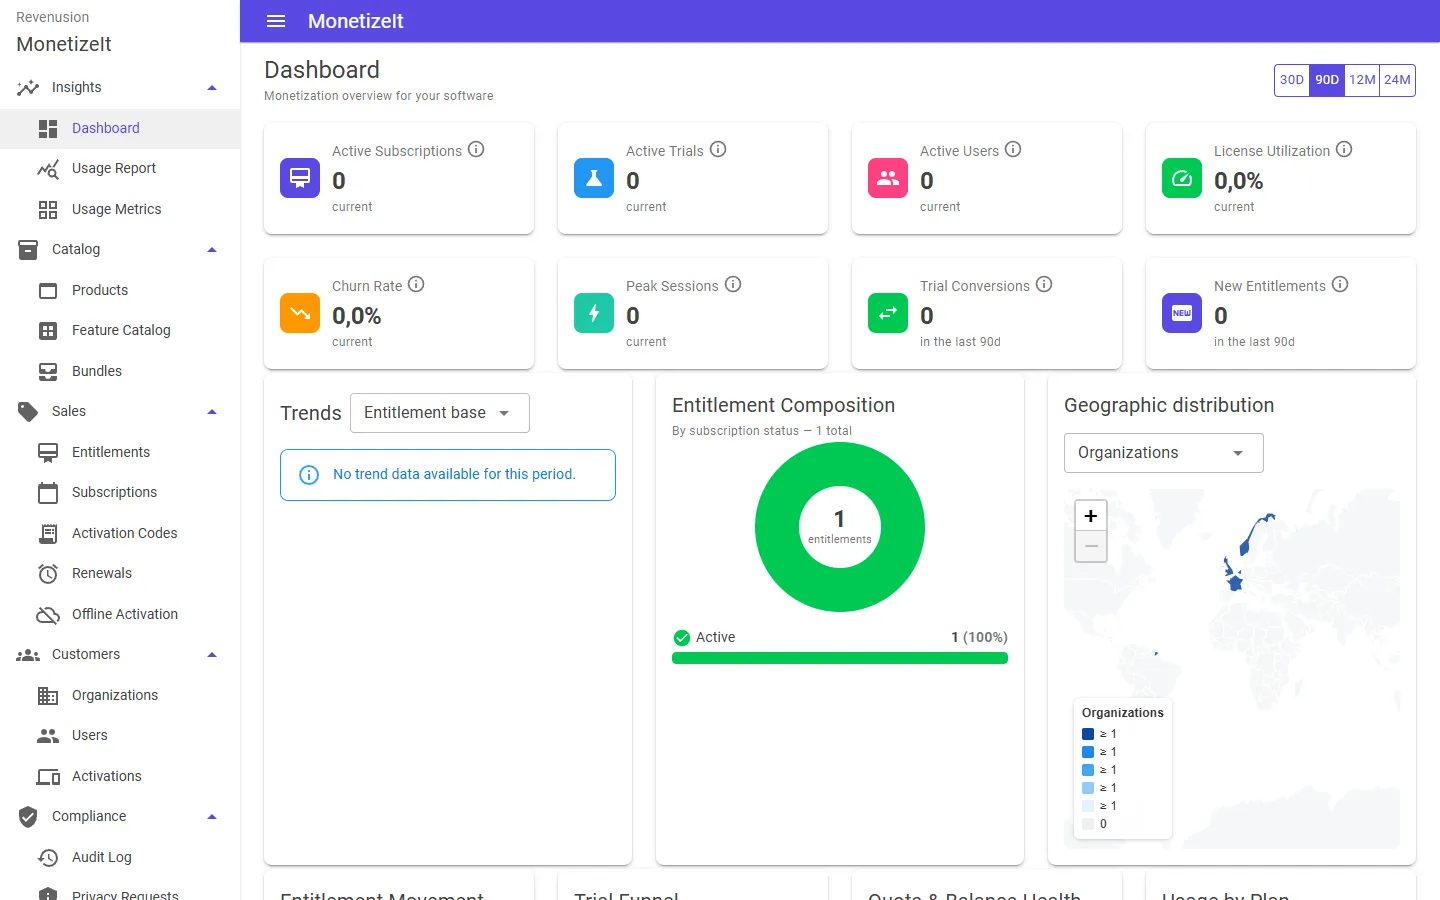
The Provision Portal dashboard — active subscriptions, trials, utilization, the entitlement mix and customer geography.
Usage by metric
Section titled “Usage by metric”Insights → Usage Metrics drills into a single metric over a period — its total, average, peak, low, latest and the change versus the previous period. Use it to spot a customer approaching a quota or a metric trending up.
Usage report
Section titled “Usage report”Insights → Usage Report is the detailed report: breakdown tables and summary cards you can read by entitlement and metric. This is the page to pull figures from for a renewal conversation or an internal review.
Session activity
Section titled “Session activity”To see what’s running rather than how much is used, look at Customers → Activations — the issued licenses with their status, product and expiry — or an entitlement’s Issued Licenses and Usage Monitoring tabs for one grant in context.
Audit trail
Section titled “Audit trail”Administrators also have Compliance → Audit Log — an account-wide, timestamped trail of who changed what (entitlements, users, settings) with before/after detail. It’s an admin view, not part of Insights; Viewers and the operational roles don’t see it.
- Act on what you see → Renewals, credits & activations
- How usage is counted → Metering, quotas & credits